Table of Contents
Overview #
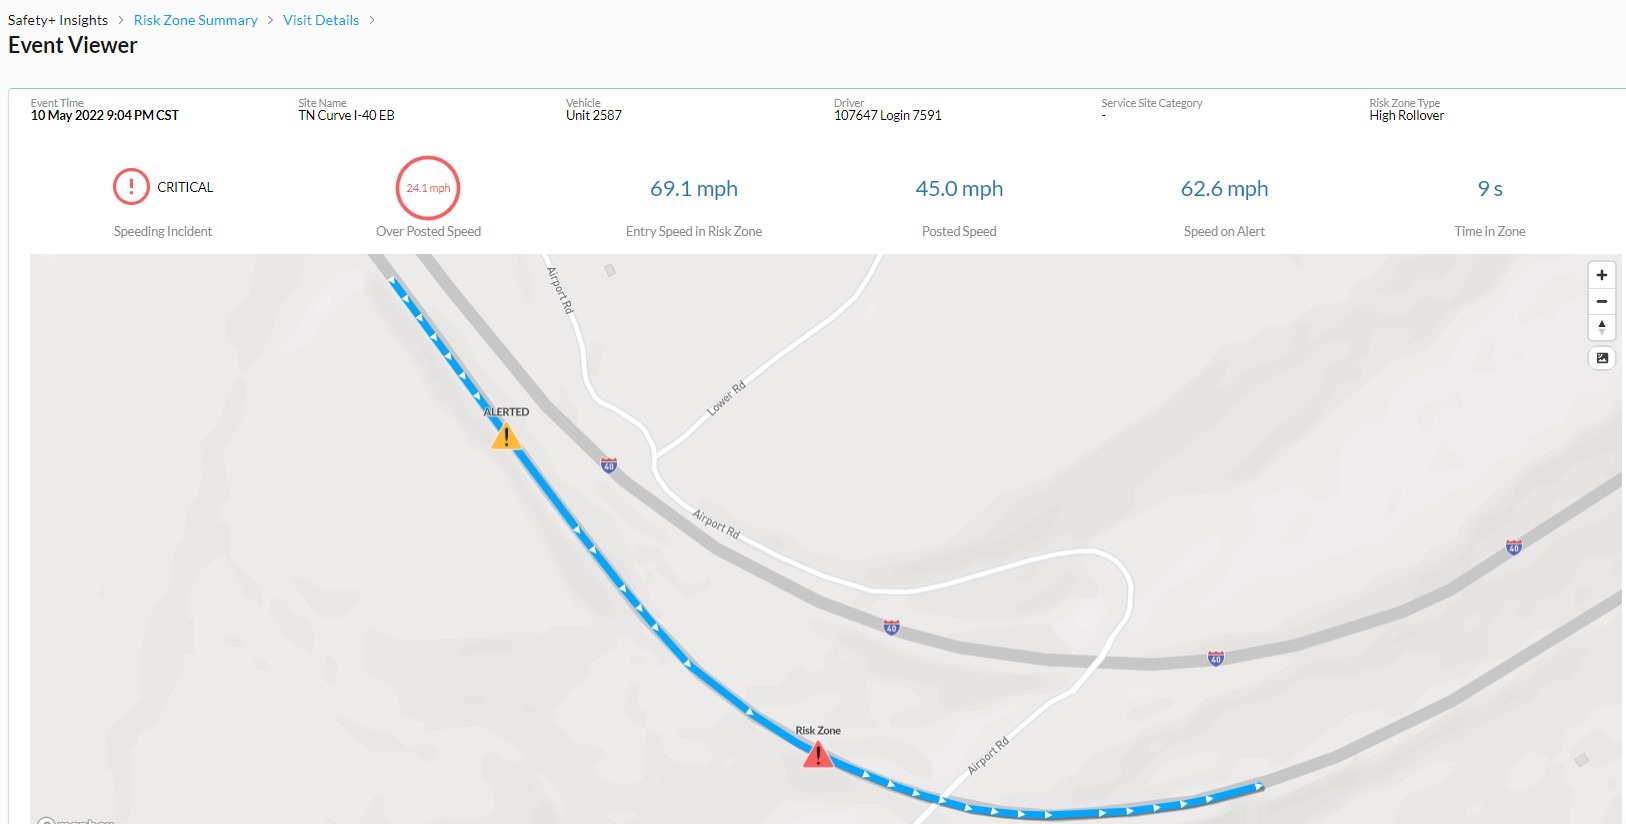
The Event Viewer gives a breadcrumb trail and performance summary for an individual event. When entering a risk zone that captures driving speed, the driver’s speed is captured at time of alert, and when entering the risk area (such as a rollover curve).
Event severity is determined relative to the posted speed of the location. Print or export this view for event reconstruction, or coaching drivers on unsafe (or safe!) driving patterns.


