Overview #
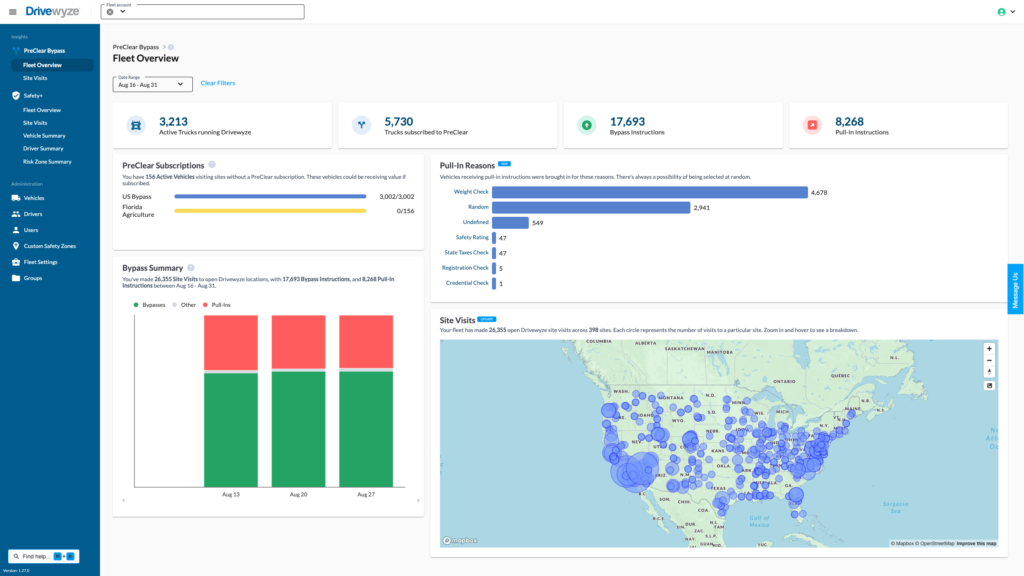
The PreClear Insights Fleet Overview dashboard provides a quick view into the overall state of the fleet for the selected timeframe. The dashboard is divided up into the following:
- Active Vehicles running Drivewyze
- Vehicles subscribed to PreClear
- Bypass Instructions
- Pull-In Instructions
- PreClear Subscription Status
- Bypass Summary
- Pull-In Reasons
- Site Visits
Filters #
Filter the data to see exactly what you want on the dashboard. Data is automatically updated to reflect the PreClear visit data.
Date Range filter #
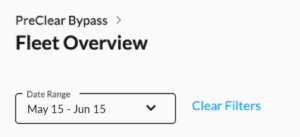
Change the date range using the date range picker. Quick date ranges are displayed in the picker. All dates are the local time of the visit location.
Note: the previous 30 complete days are shown by default.
Date quick pick range definitions:
- Yesterday: only show data from the previous day
- This week: beginning on Sunday at 12am local visit time and including today up to the most recent recorded visit. Note: visit data may be up to 6 hours delayed
- Last week: the previous week from Sunday at 12am to Sunday at 12am local visit time
- Last 7 days: the previous 7 days starting from yesterday
- Last 30 days: the previous 30 days from yesterday
- Last 90 days: the previous 90 days from yesterday
Metrics #
Active vehicles running Drivewyze #

This metric shows how many vehicles are actively running Drivewyze software in the filtered time period. They may or may not be currently subscribed to any preclear programs.
Click to open the Site Visits page to see the the visit details for each of these vehicles and see where they are active.
Subscribed vehicles #

This metric shows how many vehicles are subscribed to at least one of the PreClear programs, which include: US Bypass, Ontario Bypass, Alberta Bypass, and Florida Agriculture Bypass.
Click to open the Vehicles Administration page and view the vehicles that are currently subscribed to a PreClear program.
Bypass instructions #

This metric shows how many bypass instructions have been issued to subscribed vehicles. The bypass instructions occurred at open Drivewyze sites where the vehicle was eligible for a bypass.
Click to open the Site Visit page and view a list of the bypass instructions that were issued.
Pull-in instructions #

This metric shows how many pull-in instructions have been issued to subscribed vehicles. The pull-in instructions occurred at open Drivewyze sites where the vehicle was eligible for a bypass.
Click to open the Site Visit page and view a list of the pull-in instructions that were issued.
PreClear subscription status #
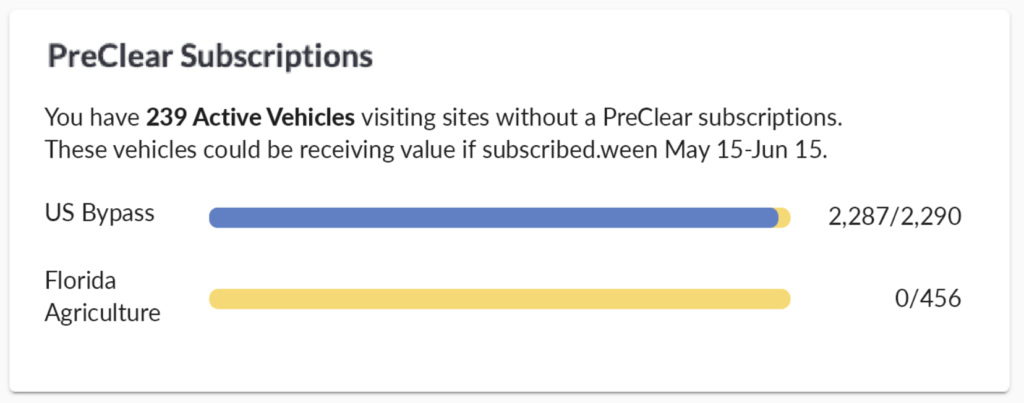
The PreClear subscription status shows how many eligible vehicles have visited PreClear sites broken out be each supported program. If a vehicle is subscribed to a program (eligible) it is represented in the bar with the total being blue. Vehicles using Drivewyze that are not subscribed to a program but are visiting sites in the program (not eligible) are represented in yellow.
Click the blue bar to open Site Visits to a filtered view of all vehicles subscribed to the program filter in the filtered date range.
Click on the yellow bar to open Site Visits to a filtered view of all vehicle visits to the selected site type without a subscription filter.
Pull-In Reasons #
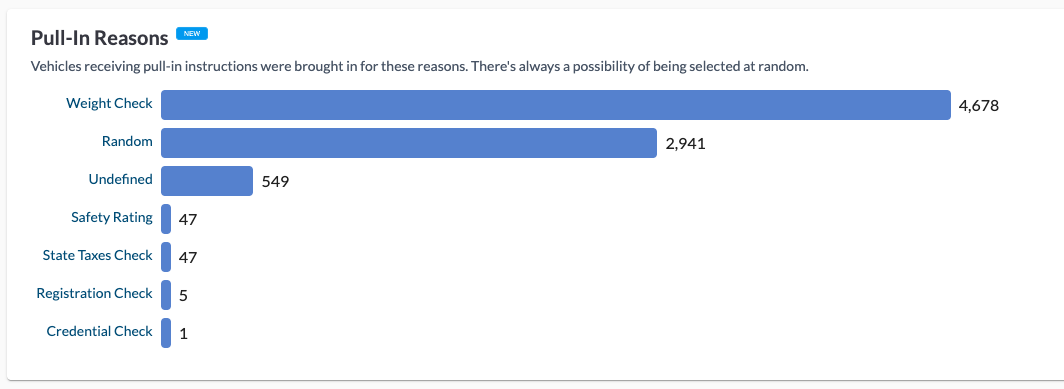
Pull-in reasons are available on each visit where the vehicle was instructed to pull into the station. Each reason is grouped into a category.
The Pull-In Reasons status shows all the Pull-I n reason categories that have occurred in the filtered date range.
Click on the reason to open the Site Visits page to view a filtered list of that particular Pull-In reason.
Check out the Pull-In Reasons Reference Guide for more detailed information.
Bypass summary #
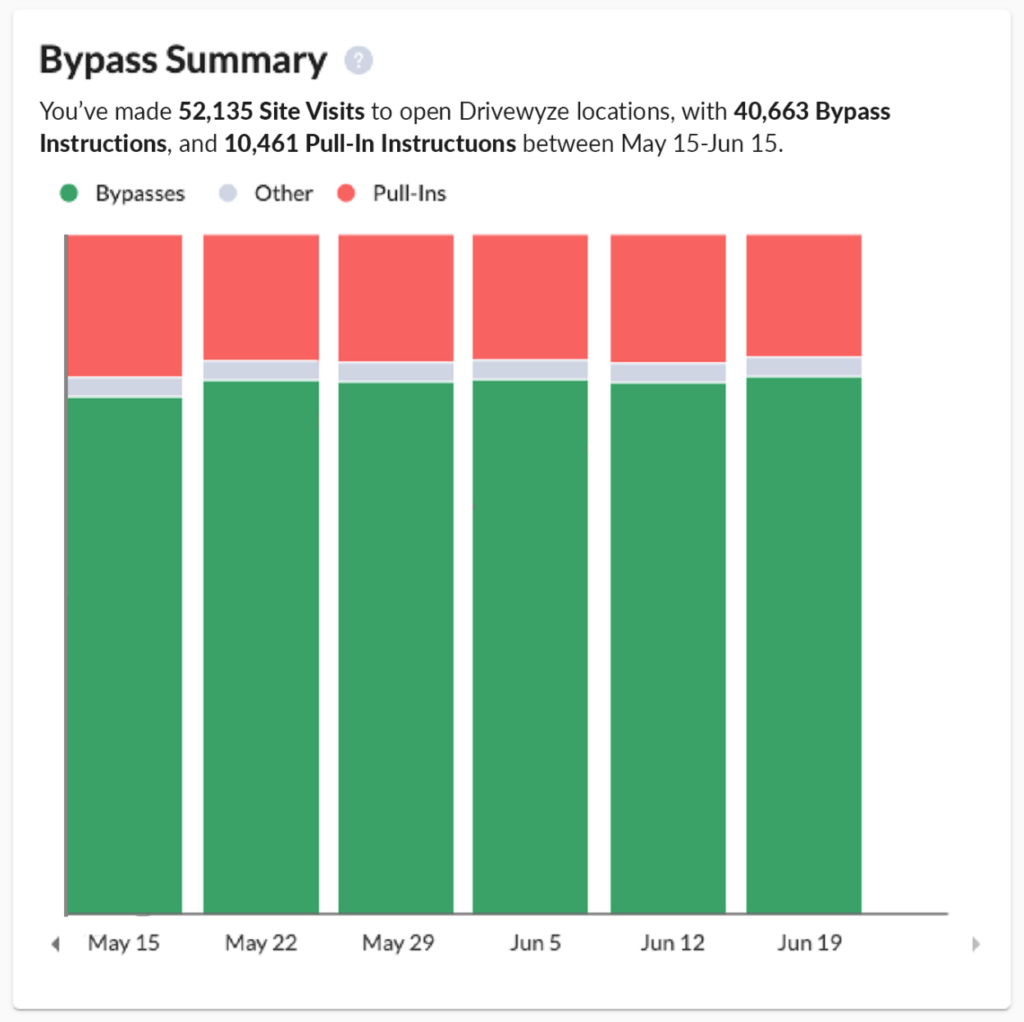
The Bypass Summary shows the percentage breakdown of what instruction (Bypass, Pull-in, Other) was displayed to your drivers over a week period. A week is a great representation of trends in a single view
Hover over the chart to see the exact details of each instruction. Green is Bypasses, red is Pull-Ins, and gray is Other. Other instructions could be “Follow Road Signs,” “Follow Transponder” or visits where an instruction was not able to be displayed.
Click a section of the bar graph to open the Site Visits page filtered to the instruction that you clicked.
Note: If a date range includes more than what can be displayed, you can scroll with a click and drag or use the arrows that are provided at the bottom of the graph.
Site visits map #
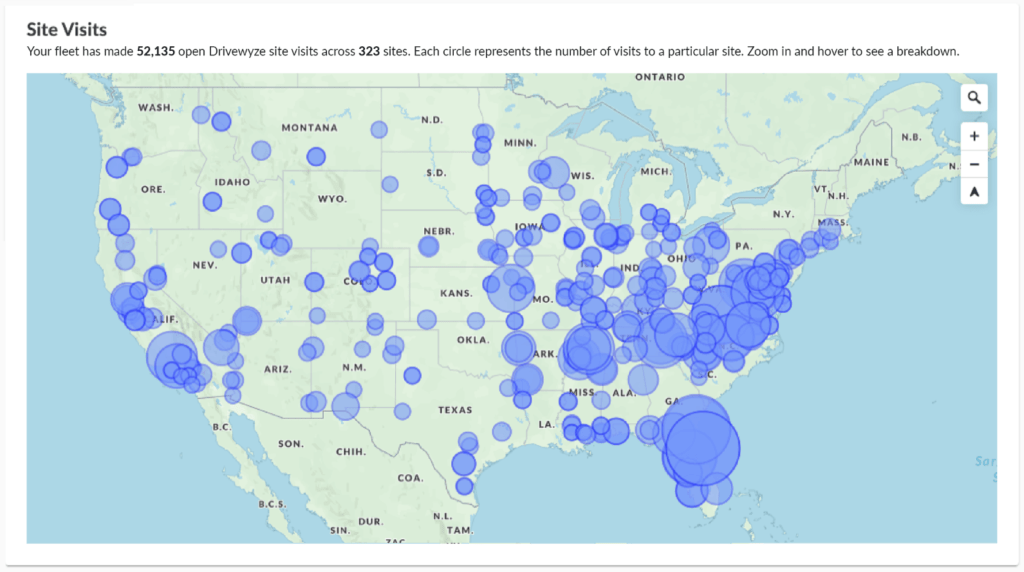
The Site Visits map shows the location and quantity of all site visits that were made to all Drivewyze supported sites. Each site location visited is represented by a circle on the map. The size of the circle is relative to the quantity of visits made overall. For example: the larger the circle, the more visits.
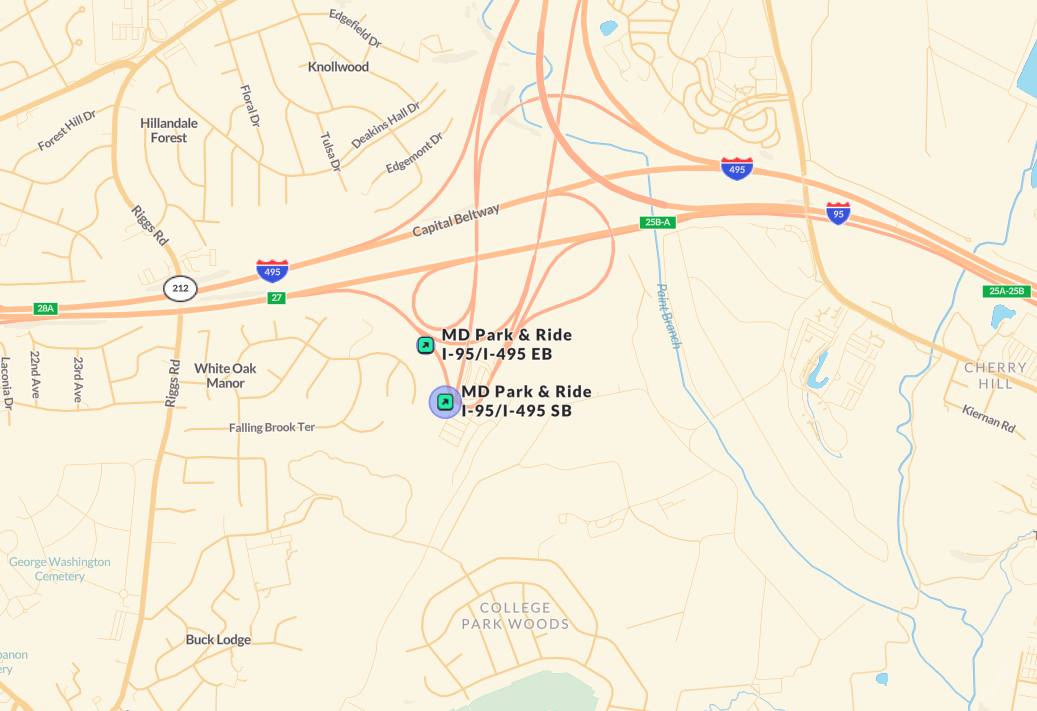
Use the map controls to zoom in and look at specific instances where bypasses or pull-ins were issued. Hover over the instance for more details about the visit, bypass, or pull-in for that specific site. Sites that are visited are revealed by name. For example, MO St-Clair I-44 EB indicates the site is located on Interstate 44 eastbound near St Clair, Missouri. In addition, when a name has been revealed it can be hovered over to view a breakdown of instructions given at the site.
Note: Some sites are very close to each other (across the highway), so make sure to zoom in close enough to view each site.


