Overview #
The Fleet Overview dashboard provides a quick view into the overall state of the fleet for the selected timeframe. The dashboard is divided up into the following tiles:
-
- Setup Status
- Safety Alert Impact Assessment
- Drivers Behavior In Risk Zones
- Risk Zone Notifications
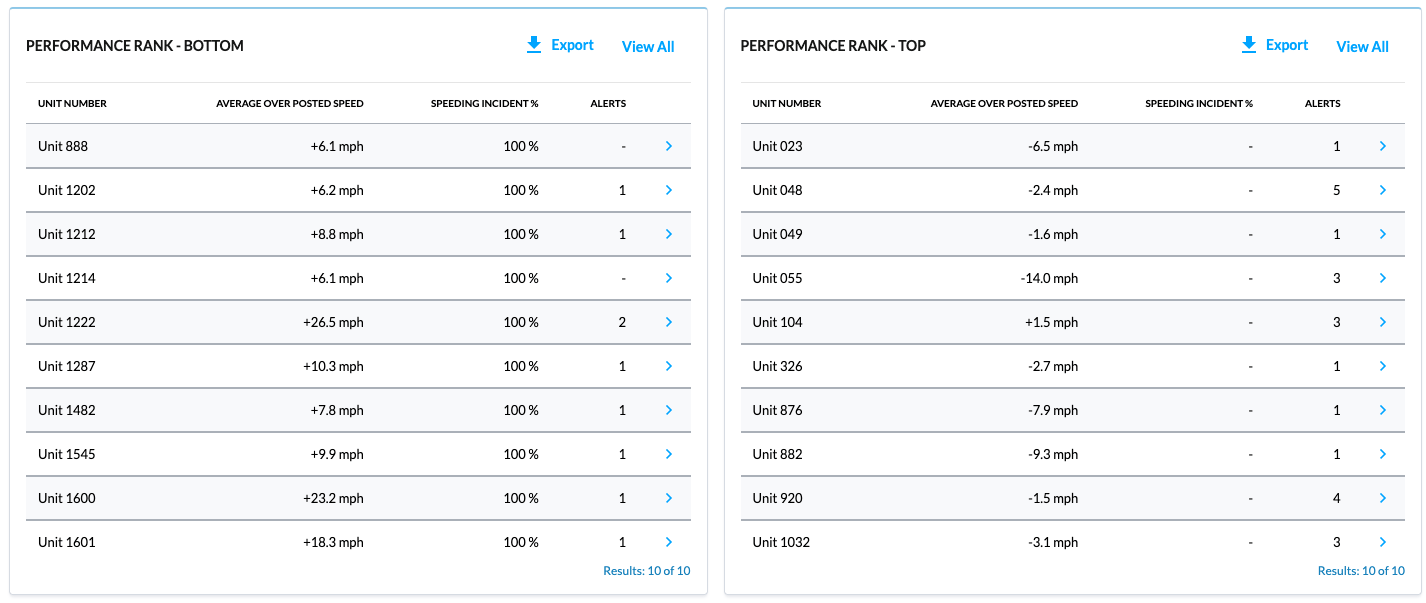
- Performance Rank – Bottom
- Performance Rank – Top
- Risk Hotspots
Setup Status #
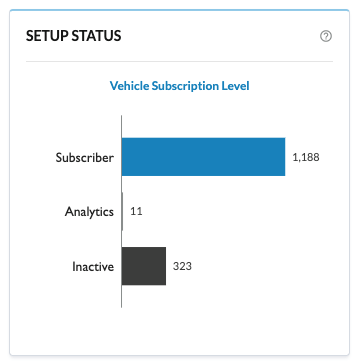
The Setup Status tile shows how many vehicles are enabled for safety notifications.
Safety Alert Impact Assessment #
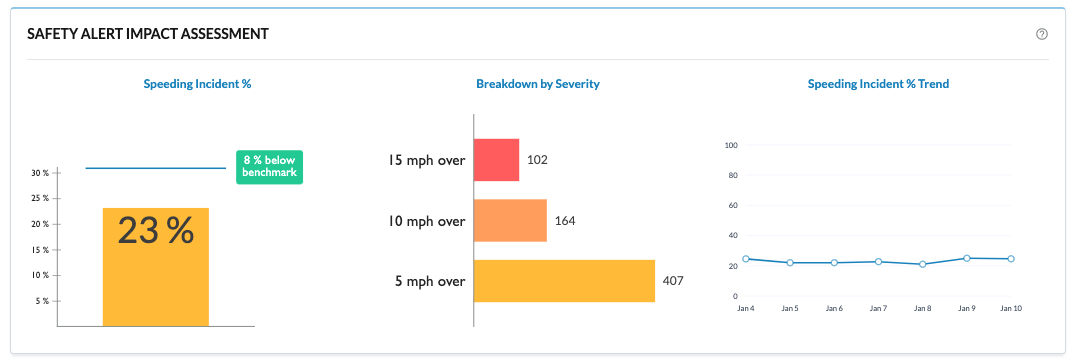
The Safety Alert Impact Assessment tile displays Speeding Incident %, Breakdown by Severity, and Speeding Incident % Trend. Speeding Incident % identifies how often drivers are at least 5mph over the speed limit in risk zones.
Driver Behavior in Risk Zones #
The Driver Behavior in Risk Zones tile shows the percentage of speeding incidents in Rollover Zones, Speed Violation Zones, and Steep Grade Zones.

Risk Zone Notifications #
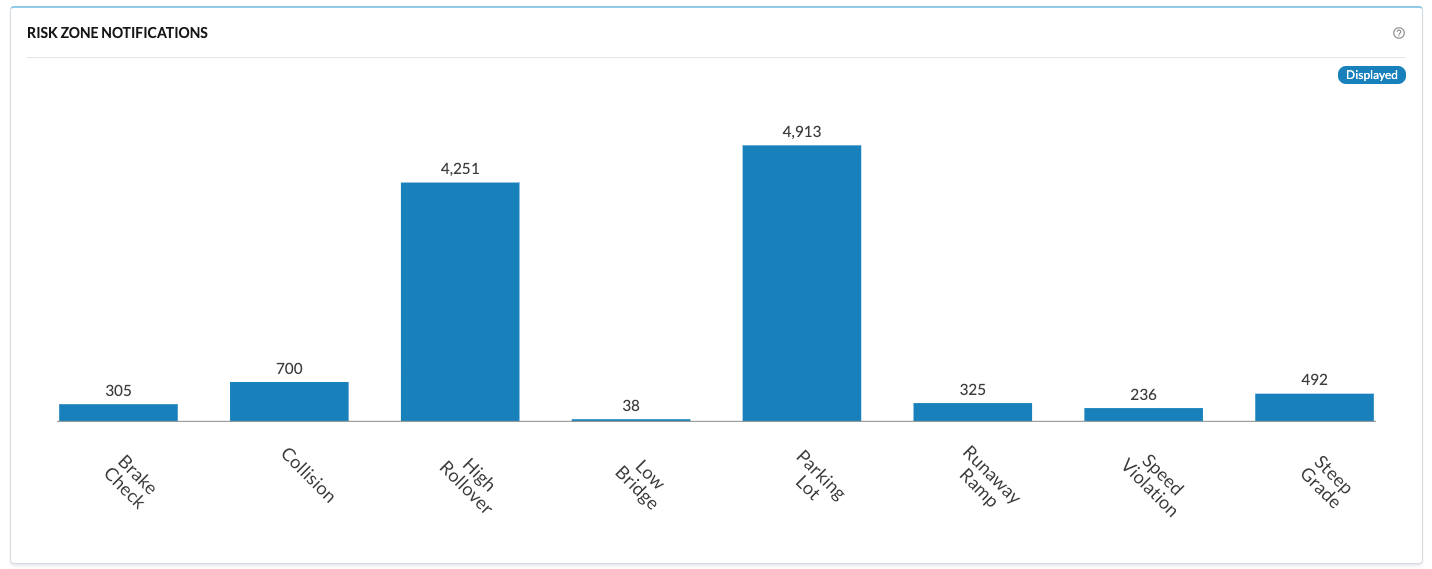
The Risk Zone Notifications Tile shows all of the notifications that have been sent per risk zone.
Performance Rank #
The Performance Rank tile is divided up into two sections:
- Performance Rank – Bottom: These are drivers that are in the bottom of the performance ranking.
- Performance Rank – Top: These are drivers that are in the top of the performance ranking.
Note: Performance Rank – Top only displays when there are at least 20 rows in total. Otherwise, only Performance Rank – Bottom is shown.
Risk Hotspots #
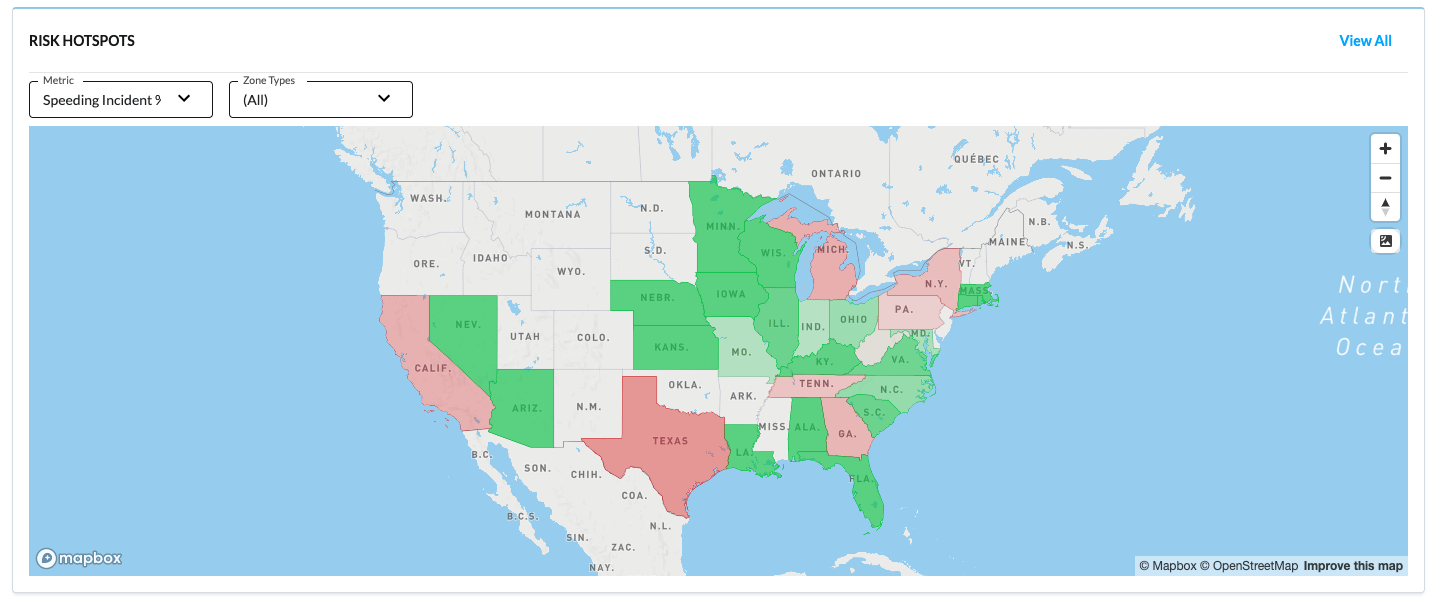
The Risk Hotspots tile shows a map of where all the alerts and incidents have occurred. Click on each state to see more details.
